How to calculate Cumulative portfolio returns in Python
Calculating Cumulative portfolio returns in Python
In the last post we learned how to construct a portfolio in python. We also learned how to calculate the daily portfolio returns. In this post we will learn how to calculate portfolio cumulative returns.
First lets load the library.
import pandas as pd
import numpy as np
import matplotlib.pyplot as plt
import pandas_datareader as web
Then lets load the ticker symbols for our assets that we will include in our portfolio.
#  Assets to be included in the portfolio
tickers = ['BND', 'VB', 'VEA', 'VOO', 'VWO']
We will also create a vector for our asset weights.
# Asset weights
wts = [0.1,0.2,0.25,0.25,0.2]
Next lets download the price data from yahoo finance.
price_data = web.get_data_yahoo(tickers,
                               start = '2013-01-01',
                               end = '2018-03-01')
price_data = price_data['Adj Close']Next we will calculate the daily returns for our assets.
ret_data = price_data.pct_change()[1:]We will then calculate the weighted average of our asset returns.
weighted_returns = (wts * ret_data)
print(weighted_returns.head())
## Symbols BND VB VEA VOO VWO
## Date
## 2013-01-03 -0.000298 -0.000120 -0.002513 -0.000225 -0.001188
## 2013-01-04 0.000155 0.001516 0.001410 0.001049 0.000354
## 2013-01-07 -0.000072 -0.000597 -0.001262 -0.000671 -0.001723
## 2013-01-08 0.000096 -0.000383 -0.001339 -0.000748 -0.001648
## 2013-01-09 -0.000036 0.000864 0.001205 0.000750 0.001168Finally the portfolio returns are the sum of the weighted returns.
port_ret = weighted_returns.sum(axis=1)
# axis =1 tells pandas we want to add
# the rows
To calculate cumulative returns we need to use the cumprod() function.
cumulative_ret = (port_ret + 1).cumprod()Lastly we will plot our portfolios cumulative returns.
fig = plt.figure()
ax1 = fig.add_axes([0.1,0.1,0.8,0.8])
ax1.plot(cumulative_ret)
ax1.set_xlabel('Date')
ax1.set_ylabel("Cumulative Returns")
ax1.set_title("Portfolio Cumulative Returns")
plt.show();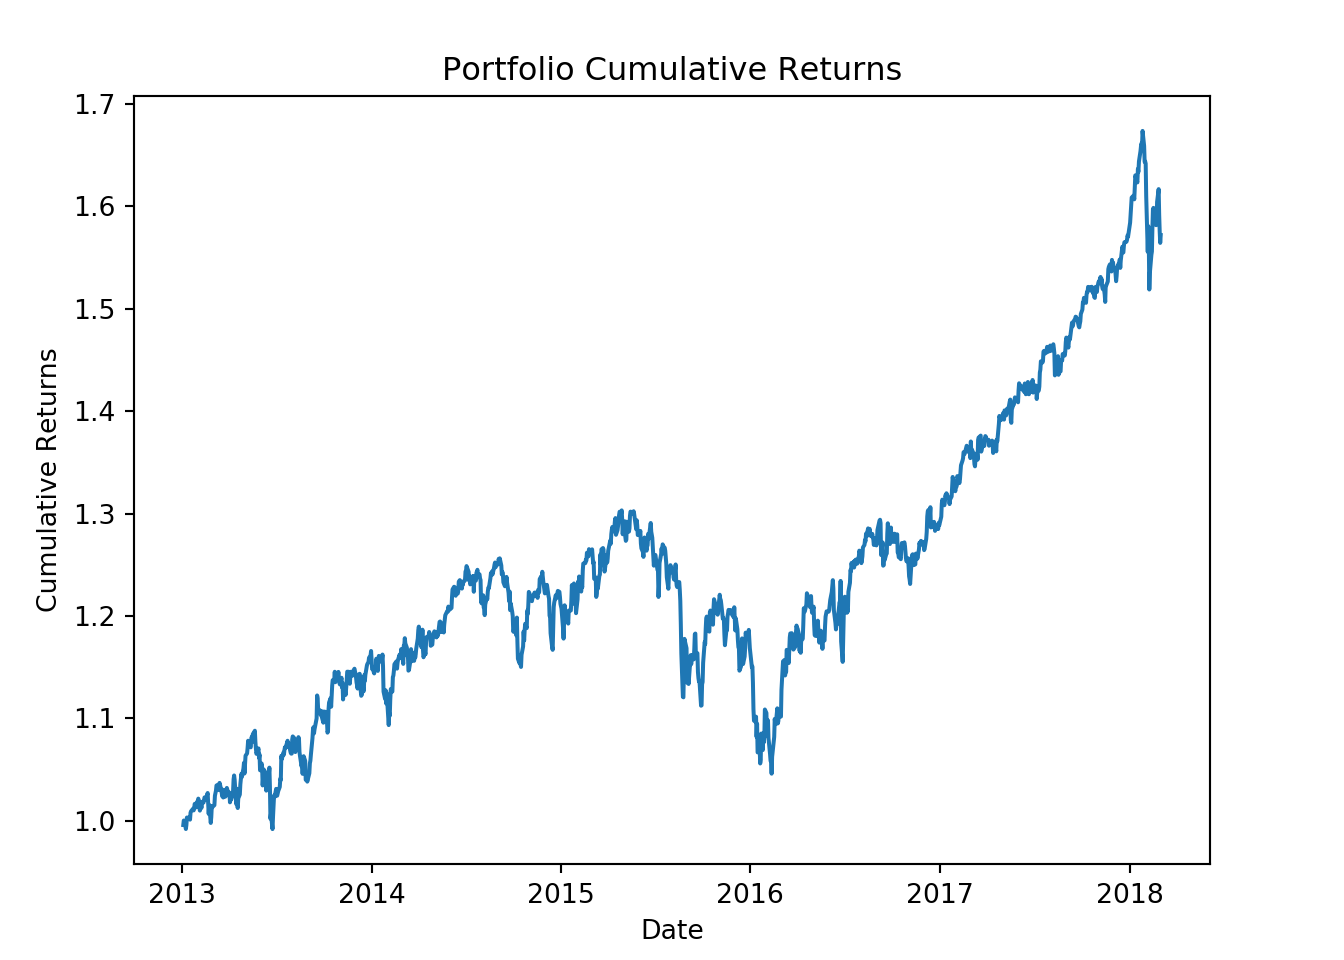
Read other posts