Webscraping with Python
Web scraping is an essential skill that is required for data exploration and analysis. In this post we will learn how to get the data from a website in Python for further research.
Suppose we want to get all the S&P 500 constituents for our portfolio research. This information is easily available on Wikipedia.com. Using the the below code we can download the tickers and other relevant data from wikipedia.
First lets load the libraries
import pandas as pd
import matplotlib.pyplot as plt
from bs4 import BeautifulSoup
from urllib.request import urlopen
Next we will write our code to get the Wikipedia table.
# Go to the website and read the html page
url = urlopen("https://en.wikipedia.org/wiki/List_of_S%26P_500_companies")
# Parse the webpage using the BeautifulSoup Library
# We will save it to the soup variable
soup = BeautifulSoup(url.read(), 'lxml')
# Get the correct data table,
# We want the table which has
# the constituents
tbody = soup.tbody
tr = tbody.find_all('tr')
# After getting the correct data
# We will need to iterate over it to
# extract just the text
# We will save it to the empty data list
data = []
for t in tr:
    data.append(t.text.split('\n'))
# Convert the list into a DataFrame
raw_df = pd.DataFrame(data)
# Change the column names to First Column
raw_df.columns = raw_df.iloc[0,:]
# Delete the first row data
raw_df = raw_df.iloc[1:,:]
# Read the head of the data table
print(raw_df.head(10))
## 0 Symbol Security ... Founded NaN NaN
## 1 MMM 3M Company ... 1902 None None
## 2 ABT Abbott Laboratories ... 1888 None None
## 3 ABBV AbbVie Inc. ... 2013 (1888) None None
## 4 ABMD ABIOMED Inc ... 1981 None None
## 5 ACN Accenture plc ... 1989 None None
## 6 ATVI Activision Blizzard ... 2008 None None
## 7 ADBE Adobe Systems Inc ... 1982 None None
## 8 AMD Advanced Micro Devices Inc ... 1969 None None
## 9 AAP Advance Auto Parts ... 1932 None None
## 10 AES AES Corp ... 1981 None None
##
## [10 rows x 14 columns]We have successfully downloaded the data and now lets plot it.
We will plot the number of constituents in each sector.
sectors = raw_df.groupby('GICS Sector').count().iloc[:,0].sort_values()
sectors.plot(kind='bar')
plt.ylabel('Number of Constituents')
plt.xlabel('Sectors', fontsize=2)
plt.title('Sector Constituents in S&P 500 as of 2019')
plt.show()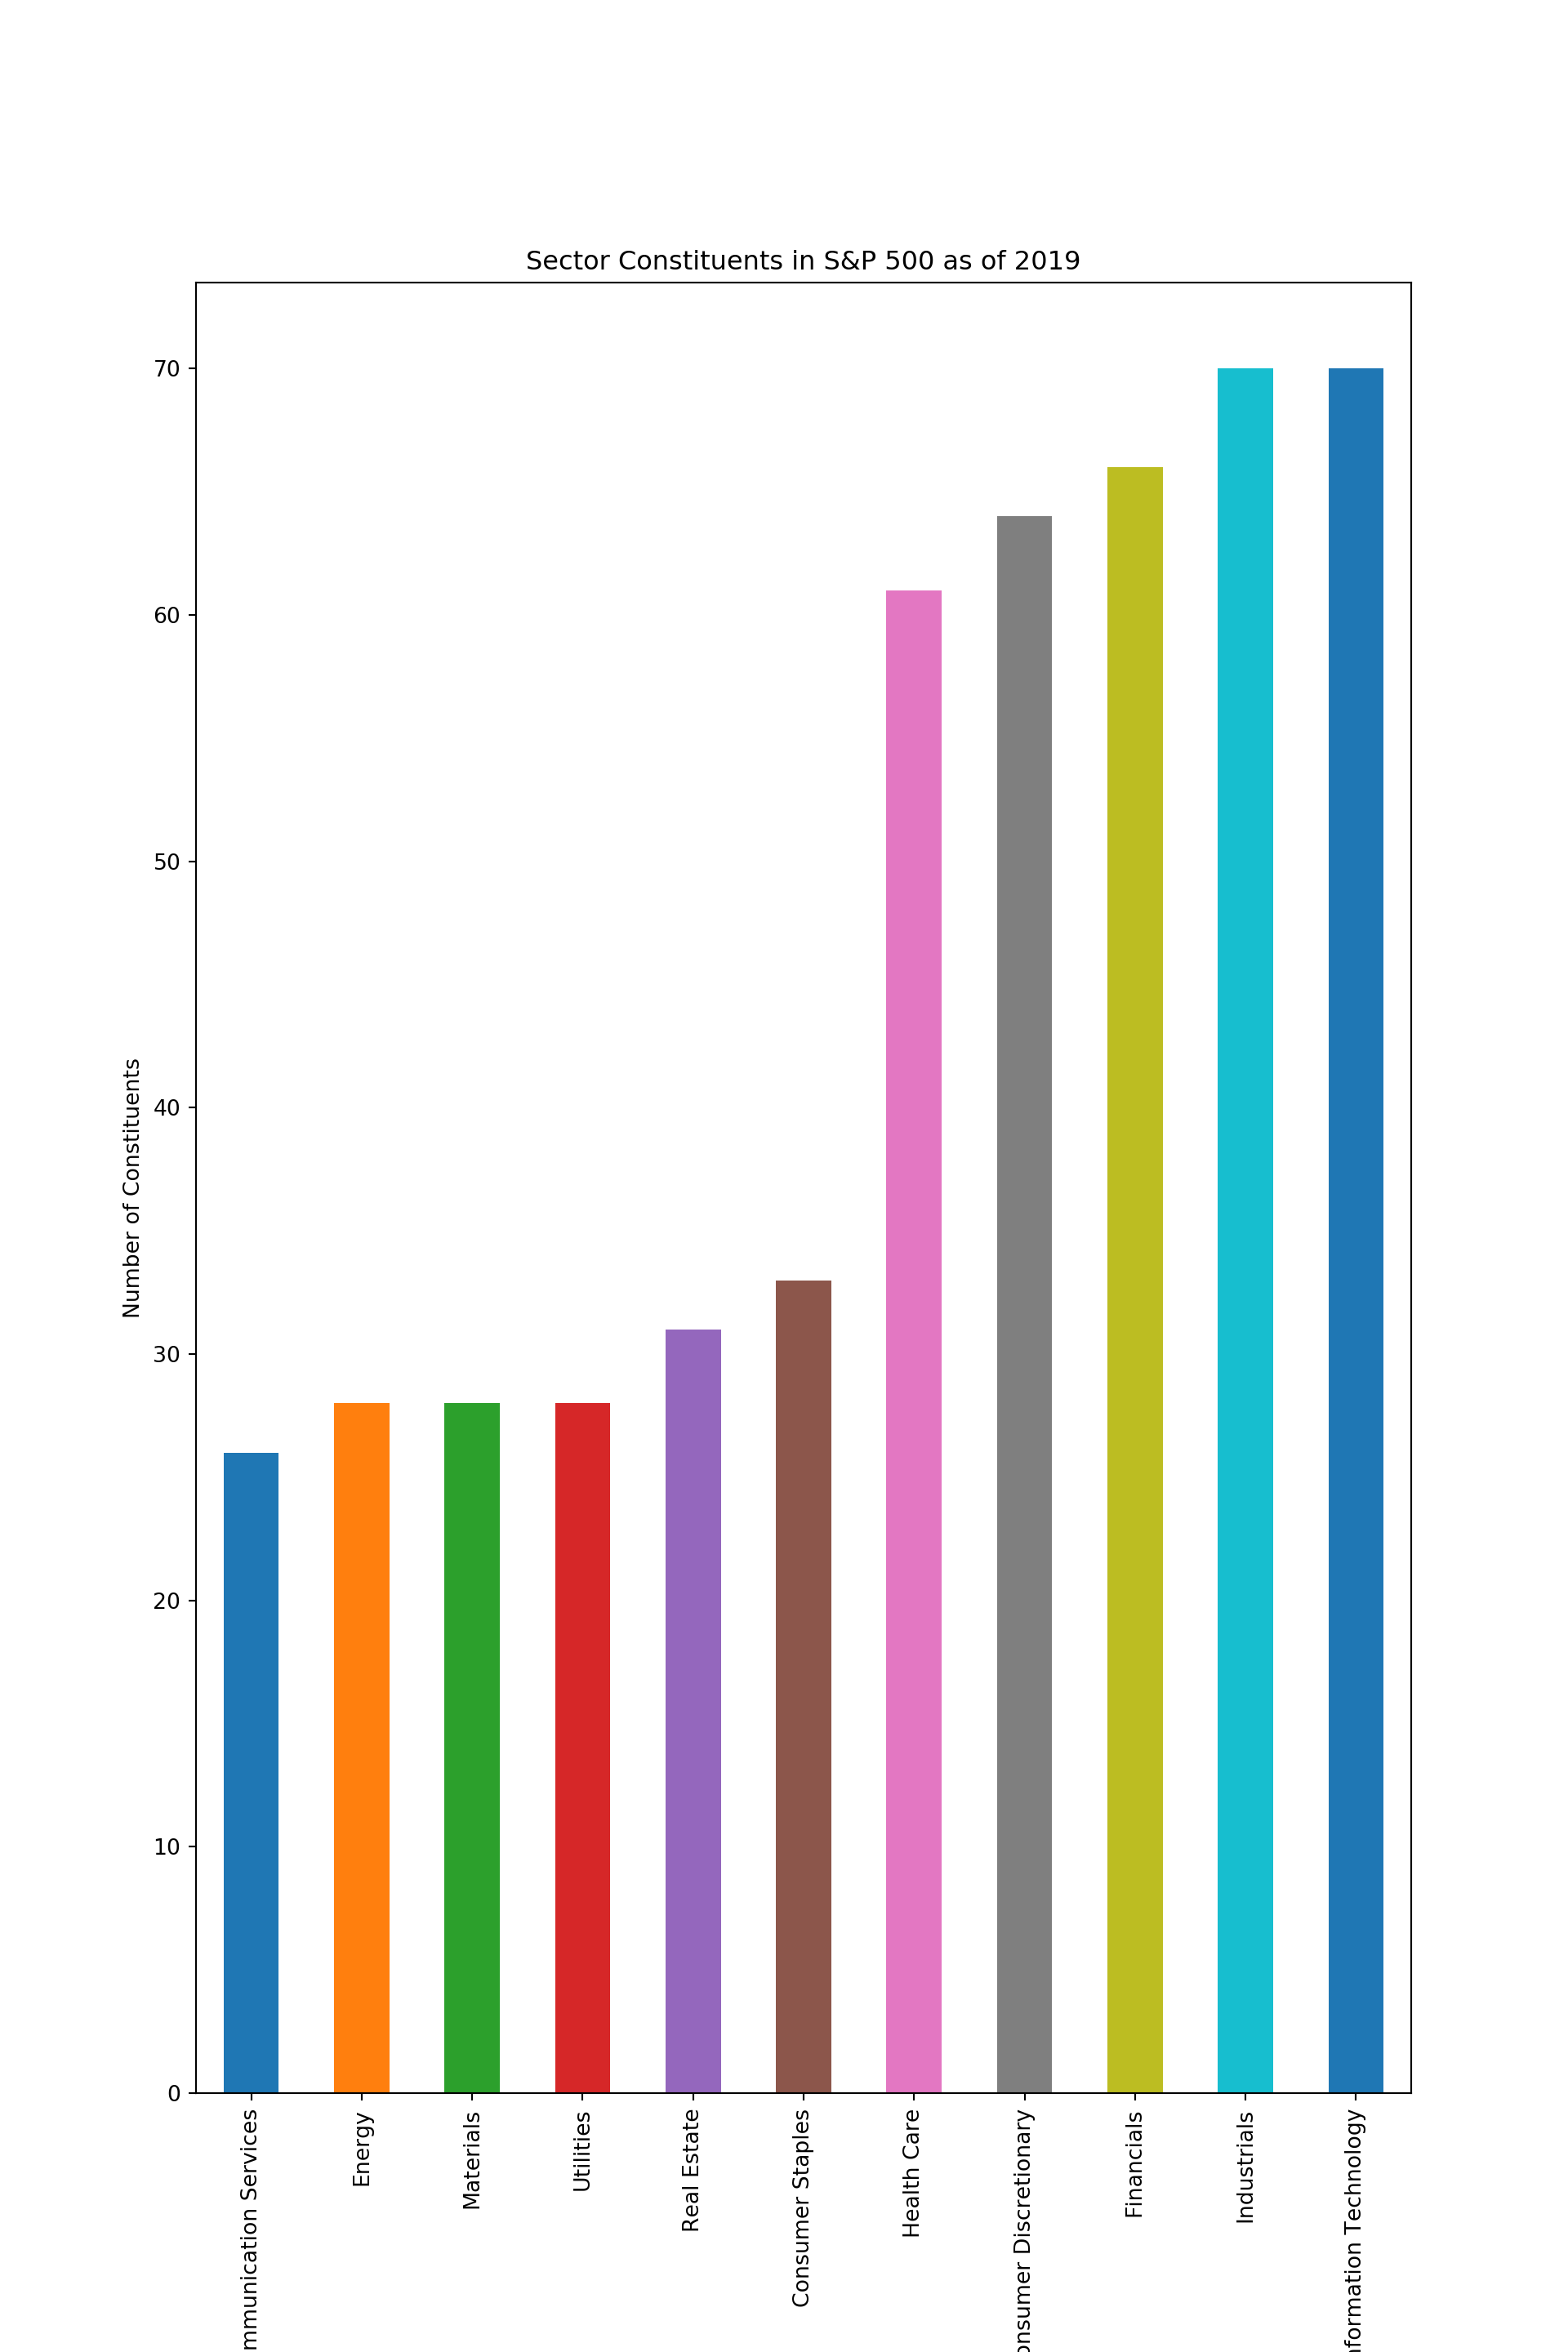
From the above chart we can quickly learn that Information Technology and Communication Services together dominate todays markets. Energy sector on the other hand has fewer constituents than Real Estate sector.